line graph
bar graph
circle graph
double bar graph
pictograph
advantages:
line graph- are best for showing changes in data over time
bar graph- are best for comparing data across categories
circle graph- are best for comparing categories to the whole using percents
double bar graph- are best for comparing two sets of data across categories
pictograph- are bast for comparing data that can be easily counted and represented using symbols
disadvantages:
line graph-it can only be used to show data over time
bar graph- graph categories can be recorded to emphasize certain data
circle graph-it usually has things in general it is not specific
double bar graph- you can get confused by both of them together
pictograph-it my be difficult to find a symbol to represent the data
2. How can graphs be misleading. show 3 ways
 |
| this graph can be misleading because #2 looks like a lot more but the intervals are 10. |
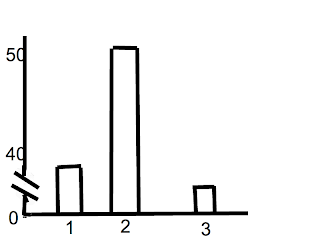 |
this graph is misleading because # 2 looks like a lot more than #1 and #3 but because of the break in the y-axis the huge interval is only 10.

This graph is misrepresenting because #2 makes you look at it because it is larger than all the other ones
2a) The following chart shows pizza sub sales over a month. what 2 graphs would show the information accurately?
Line graph and bar graph
2b) If you were selling pizza subs would you continue? how does your graph explain your answer.
Yes, the line graph explains my answer because you can see a trend

4. below you see 2 different examples of graphs showing healthy choices sold at the canteen. if you had to convince Mrs. Mota that we should continue selling healthy choices which graph would you choose?

I would choose the line graph because you can see a trend
4a) Change each graph so that your information looks even MORE impressive. You may not change the data just the graphs


No comments:
Post a Comment
Note: Only a member of this blog may post a comment.