1. Use your notes to list the different types of graphs. Please list the advantages and disadvantages of each graph.
Bar Graph
Advantage - Is the bar graph you can clearly compare the different categories and tell which one is the most popular.
Disadvantage - Is that you cant tell what the exact the number.


Circle Graph
Advantage - You can compare the data to the whole percent easily.
Disadvantage - You have to do a lot of work to get the percent of the categories .
Distorting the bar
When you distort the bar you make one look 3-D , colour one of the bars a different colour than the rest,Make on of the bar wider. You do this to make one of the bars stand out so it seems more importation.
When you distort the visuals, you would want to take the one with the less number and make the picture bigger so seems that if has the same numbers or even more.
When you distort the scale you make a break in the y axis, when you have a break you want it to be big so its more different.
3) The following chart shows Pizza Sub Sales over a month. What 2 graphs would show the information accurately?

I would use the pictograph because there seems to be a big different from September and November

Bar Graph
Advantage - Is the bar graph you can clearly compare the different categories and tell which one is the most popular.
Disadvantage - Is that you cant tell what the exact the number.

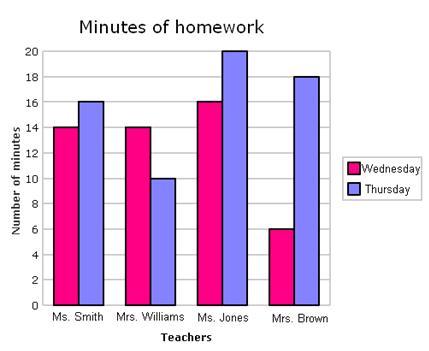
Double Bar Graph 

Advantage - Can compare two different types of data sets.
Disadvantage - Is that you meant get confused with the two different sets of data.
Disadvantage - Is that you meant get confused with the two different sets of data.
Pictograph
Advantage - You can clearly tell what the exact number is.
Disadvantage - Is that you can only use the pictograph when the numbers are even.
Advantage - You can clearly tell what the exact number is.
Disadvantage - Is that you can only use the pictograph when the numbers are even.

Circle Graph
Advantage - You can compare the data to the whole percent easily.
Disadvantage - You have to do a lot of work
 to get the percent of the categories .
Line Graph
Advantage - Is that you can see your trend over time really easily.
Disadvantage - Is that you can only use the line graph for over time data.

Advantage - Is that you can see your trend over time really easily.
Disadvantage - Is that you can only use the line graph for over time data.

2. How can graphs be misleading. Show 3 ways.
Distorting the bar
When you distort the bar you make one look 3-D , colour one of the bars a different colour than the rest,Make on of the bar wider. You do this to make one of the bars stand out so it seems more importation.
Distorting the Visuals
When you distort the visuals, you would want to take the one with the less number and make the picture bigger so seems that if has the same numbers or even more.
Distorting the Scale
When you distort the scale you make a break in the y axis, when you have a break you want it to be big so its more different.
3) The following chart shows Pizza Sub Sales over a month. What 2 graphs would show the information accurately?

Bar Graph and Line Graph
Bar graph because its best for comparing categories
Bar graph because its best for comparing categories
Line Graph because its best for comparing data over time.
3a) If you were selling Pizza Subs would you continue? How does your graph explain your answer.
3a) If you were selling Pizza Subs would you continue? How does your graph explain your answer.

I would use the pictograph because there seems to be a big different from September and November

No comments:
Post a Comment
Note: Only a member of this blog may post a comment.