Bar graph
advantage-This is good because it snows data across the categories.
disadvantage-It is hard to see the number.
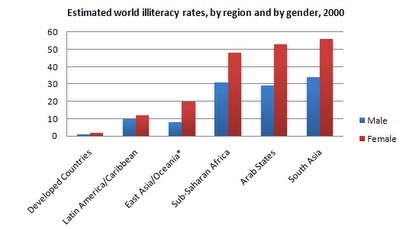
double bar graph
advantage-This is good for showing change over time.
disadvantage-Its difficult to see the number that it actually is.
Pictograph
advantage-Its an easy way to represent symbols.
disadvantage-You have to use multiplication to to have the total number.

line graph
advantage-Its good for seeing change over time
disadvantage-Its hard to Identify the exact amounts.

advantage-Its good for catagories shown in percents.
Circle graph
advantage-Its good for catagories shown in percents.
disadvantage-You have to make a percent out of a number.
2 How can graphs be misleading?
show three ways
a) on bar graphs make the bar wider, 3d, colourfull.
b)Distort the pictures in the pictographs to make it pop out wich makes it bigger than it is.
c)Brake the Y axis.
3 a)The graph that I would use would be a bar graph because it shows the data across catagories.
3 b)I would Keep selling the pizza subs because the items sold keeps getting higher.
4 a) I would use the line graph because it is looks more impressive.
b) To make the line graph more impressive I would go up for example by 2's instead of 5's.
No comments:
Post a Comment
Note: Only a member of this blog may post a comment.