Showing posts with label graphing post. Show all posts

Monday, December 12, 2011

Camille's Graph Post

The different types of graphs is:

Bar Graph- Th advantages are best for comparing data across categories.
The disadvantages


Line Graph-
The advantages are best for showing changes in data over time.
The disadvantages

Double Graph-
The advantages are best for comparing two sets of data across categories.
The disadvantages

Pictograph-
The advantages are best for comparing data that can be easily counted and represented using symbols.
The disadvantages

Circle Graph-
The advantages are best for comparing categories to the whole using percents. The sum of the percents in a circle graph is 100%
The disadvantages

2. How can graphs be misleading. Show 3 ways.

  • Uneven Scale
  • No title
  • No labels

2a) The following chart shows Pizza Sub Sales over a month. What 2 graphs would show the information accurately?
Line Graph and Bar Graph. Line graph because are the best for showing changes in data. Bar Graph is the best for comparing data across categories.

2b) If you were selling Pizza Subs would you continue? How does your graph explain your answer
.
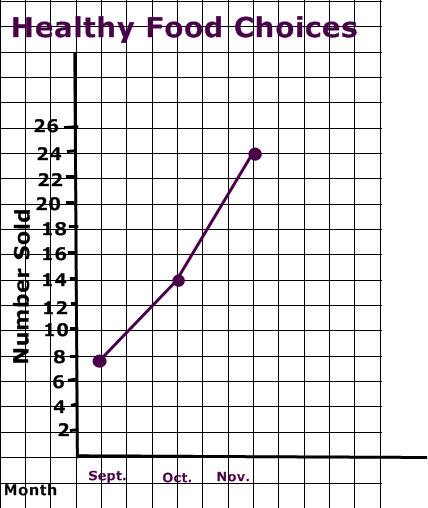
4. Below you see 2 different examples of graphs showing healthy choices sold at the canteen. If you had to convince Mrs Mota that we should continue selling healthy choices which graph would you choose?
I would choose the Line graph because it looks more impressive.
4a) Change each graph so that your information looks even MORE impressive. You may not change the data just the graphs
.


Monday, November 14, 2011

Marielle's Graphing Post

Types of Graph

Bar Graph
Advantage- Best comparing data across categories.
Disadvantage- Can not easily figure the exact number.
Double Bar Graph
Advantage- Best comparing two sets of data across categories.
Disadvantage- can not easily figure the exact number.
Line Graph
Advantage- Best for showing changes in data over time.
Disadvantage- Not best for comparing data across categories.

Double Line Graph
Advantage- Best for comparing two sets of data across categories.
Disadvantage- Not best for comparing the data of each across categories.
Circle Graph
Advantage- Best for comparing categories to the whole using percents.
Disadvantage- Can not determine the exact number/total and have to change the number and percent
Pictograph
Advantage- Best for comparing data that can be easily counted and represented using symbols.
Disadvantage- multiply how many picture there are and how many of each picture cost.
Misleading Graph
- Distorting the scale (Breaking the y-axis)
- Distorting visual (Make an image larger)

-Distorting bar size (Make bar/s wider)

2a) The following chart shows Pizza Sub Sales over a month. What 2 graphs would show the information accurately? I would use pictograph and a graph
2b) If you were selling Pizza Subs would you continue? How does your graph explain your answer
I would continue selling because every month the pizzas are being sold is getting higher and higher.
If I had to convince mrs. Mota That we should continue selling heathly food choices, I would choose the line graph, the trend of the line graph keeps getting higher and higher, which means the sales gets better and better.


Sunday, November 13, 2011

Lance's Graph Post

1)Bar Graph:
Advantages: The advantage of this graph is having not to change the data to a percent or other things
Disadvantages  You will need to make the intervals equal              

Double Bar Graph:
 Advantages: You can compare two sets of data together
Disadvantages: You will have to make the intervals equal

Circle Graph:
Advantages: You can compare sets of data using a percent
Disadvantages: You will need to change the data to a percent

Line Graph:
 Advantages: You can show the data changing over time
Disadvantages: You will need to make the lines straight and intervals equal

PictoGraph:
Advantages: You can show sets of data that is like a bar graph
Disadvantages: You can mess around with the data to make one look larger

2)Make one of the bars larger than the other


Break in the y-axis


Color one differently


2A) I would use bar graph and line graph to show this information accurately
2b)Yes I would continue because it shows that every week the sales are increasing which means the trend is going up

4)If i were to convince Mrs. Mota I would choose the line graph because it shows that the trend is going up which means that the sales of healthy food choices are increasing or decreasing

4a)For the Line Graph I would change the intervals so instead of going up by 5 I would go up by 2 to make the trend look like its increasing more
For the Pictograph I would change what the amount of 1 heart is so instead of 1 heart represents 4 sold I would make it like 1 heart represents 2 sold to make it look longer

Heres a Video that helps you understand more about bar graphs

Cyerra's Graphing Post

1)

Bar Graph
Advantage: Best for comparing data.
Disadvantage: Could be easily misinterpreted.

Double Bar Graph
Advantage: Best for comparing two sets of data.
Disadvantage: Could be easily misinterpreted.

Line Graph
Advantage: Best for showing changes in data overtime.
Disadvantages: It doesn't show the data clearly.

Pictograph
Advantage: Uses symbols to show data.
Disavantage: Could be easily misinterpreted.

Circle Graphs
Advantage: Compares data to the whole using percents.
Disadvantage: It's not accurate.

2)


Break in the y-axis


Make One Bar Wider


Make one bar different coloured.


Two graphs that would show the information accurately would be a line graph and a bar graph.


I would continue selling pizza subs because according to the graph, the sales are going higher and higher.

Saturday, November 12, 2011

Angelika's Graph Post

Bargraph
Advantage: Is best for comparing data across categories
Disadvantage: It's hard to determine the actual number

Double Bar Graph
Advantage: Is best comparing two sets of data across categories
Disadvantage: It's difficult to know the exact number

Line Graph
Advantage: Best for showing changes in data over time
Disadvantage: The exact amounts aren't clear depending on the scale

Pictograph
Advantage: It's best for data that can be easily counted
Disadvantage: You can only use pictograph if the data is even

Circle Graph
Advantage: Best for comparing categories to whole using percent
Disadvantage: You have to multiply to determine the number

How a graph can be misleading?
1: Break in the y axis
2: Making one bar larger
3: Changing the colour of a bar
4: Making one 3D

3.a What two graphs would you use?
Line Gtaph & Bar Graph
It would show the Pizza Subs sale over time

3b
If you were selling Pizza Subs would you continue?
I would continue it shows the sales getting higher and higher over time

4).
Below you see 2 different examples of graphs showing healthy choices sold at the canteen. If you had to convince Mrs. Mota that we should continue selling healthy choices which graph would you choose?
I would choose the line graph because it shows Mrs.Mota that it goes higher and higher over time. If you choose the pictograph you have too count and count until you find the exact amount.

4a).
Change the graph, to make it look more impresive. you may not change the data.


Friday, November 11, 2011

Joanna's Graphing Post

Bar Graph
advantages: is best for comparing data
disadvantages: does not show an accurate amount or number

Double Bar Graph
advantages:is most likely to be used for comparing two different data across the same categories
disadvantages: does not show the precise amount

Line Graph
advantages: shows the changes in data's over time
disadvantages: exact number is not likely to be shown. estimation is considered necessary

Circle Graph
advantages: best for comparing categories to the whole using percent
disadvantages:hard to comprehend

Pictograph
advantages: shows data through symbols that represent a certain number
disadvantages: multiplication is necessary to know actual number


A graph can be misleading

a) Distorting the Scale
- breaking in the y axis

b)Distorting Visuals
- making the picture bigger

Note: each flower represents
5 people voted to a
particular flower

c)Distorting the Bar Size
-making the bar larger,
emphasizing it's large amount


3a)The following chart shows Pizza Sub Sales over a month. I would choose a bar graph and a line graph to show the information more accurately.

3b)Yes i would continue. Because my graph only shows that my sales gets higher and higher.


4) If I had to convince Mrs Mota that we should continue selling healthy choices, i would use the Line graph. Because just by looking at it, Mrs. Mota would notice that the lines are going higher and higher.


Thursday, November 10, 2011

Liam's graph post

the five kinds of graphs are:


bar graphs,double bar graph,circle graph,line graphs,and pictographs.